We’re excited to introduce a new feature within the Power Link portal! If you have a ModPro monitor, you will now see an additional section under the Dealer Content tab named Dashboard. Clicking this section will display all collected Modbus data in one convenient view.
Features of the Modbus Dashboard:
Dynamic Data Fields – Dashboard fields automatically update based on the Modbus registers configured for the monitor.
Manual Refresh Button – Instantly refresh the displayed data at any time.
Auto-Refresh Option – Automatically updates data, functioning similarly to the refresh settings on the Views page.
Live Analog Values & Alarm Conditions – View available analog readings and active alarm conditions pulled directly from Modbus registers.
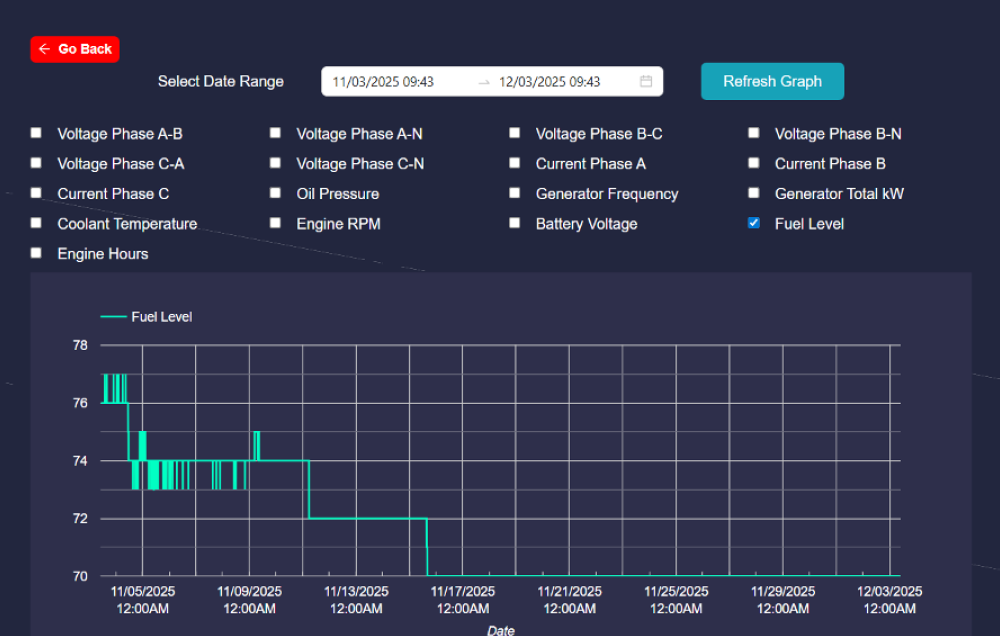
New Trend Graph Feature
At the bottom of the Modbus Dashboard, you’ll also find a Trend Graph option. This tool allows you to:
- Select up to 2 analog values to graph
- Choose custom date ranges
- Easily visualize trends and performance data over time
To learn more about Power Link, visit the Help tab from within your portal and watch our new Platform Tutorial Videos or reach out to schedule a walkthrough with our Team, 855-992-5501.